IPv6 vs IPv4 traffic graphs in MikroTik
Out of curiosity I wanted to know how much of my Internet traffic uses IPv6 vs the legacy IPv4.
There is no out-of-the-box graph for this in MikroTik.
Several forum and Stack Overflow posts suggest using ratelimiting queues with their graphing feature to collect this data.
After experimenting a bit, I ended up with the following configuration which creates two queues to collect the traffic data.
Important to know, traffic flows on a first-match basis through the queues. Thus the trick of having first the queue matching IPv6 traffic and then the queue matching all the remaining traffic.
Also, I use 10G as 'unreachable' traffic limit to avoid any traffic being ratelimited. This works well for my 1Gbit/s setup, but will need to be adjusted if you have a higher bandwidth.
/queue simple add limit-at=10G/10G max-limit=10G/10G name=v6-traffic queue=ethernet-default/ethernet-default target=2000::/3 total-queue=ethernet-default
/queue simple add limit-at=10G/10G max-limit=10G/10G name=v4-traffic queue=ethernet-default/ethernet-default target="" total-queue=ethernet-default
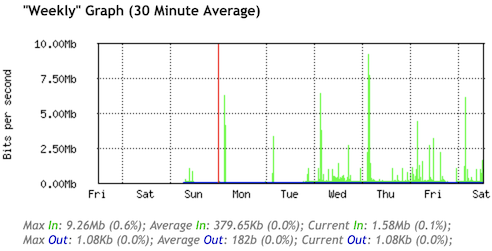
Having the queues in place for a couple days results in the following graphs:
IPv6 Traffic
IPv4 Traffic
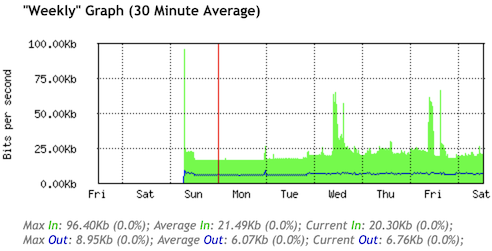
Happy to see that a large majority of my traffic uses IPv6 :-)